Advanced Mode Trigger
Sometimes a simple trigger (Simple Threshold Trigger) doesn’t provide enough flexibility for your task.
For example, you may want to receive a notification when 5% of user requests take up more than a second to process, but only if there are more than 100 requests per minute. Usually, you will have two separate metrics for this:
Nginx.requests.process_time.p95- 95th percentile of request processing time in millisecondsNginx.requests.count- request count per minute
Maybe you can construct a monstrous Graphite expression to reflect this combination, but Moira’s Advanced Mode is better:
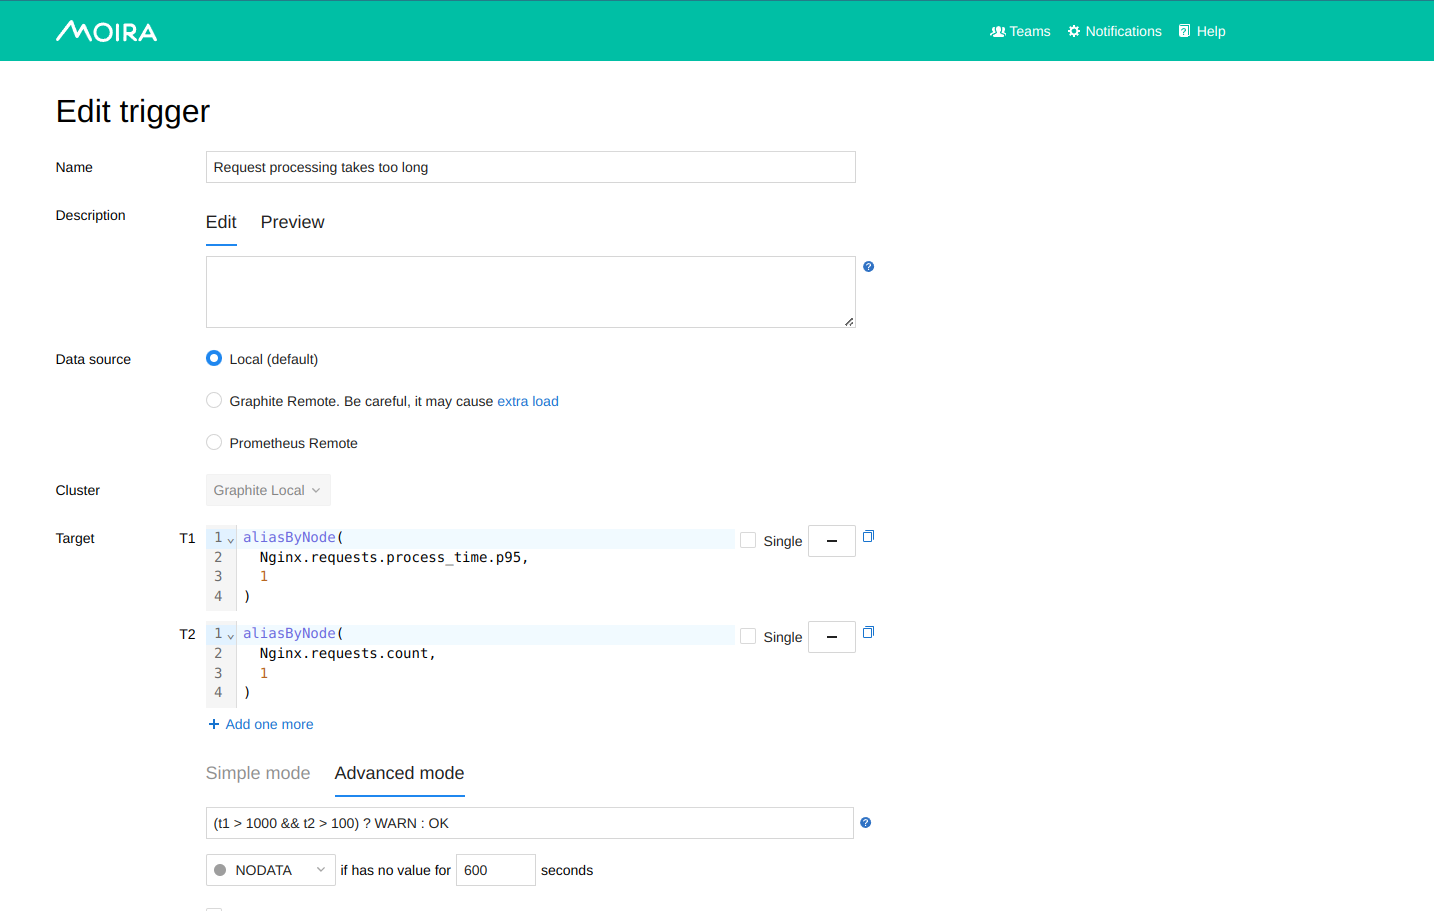
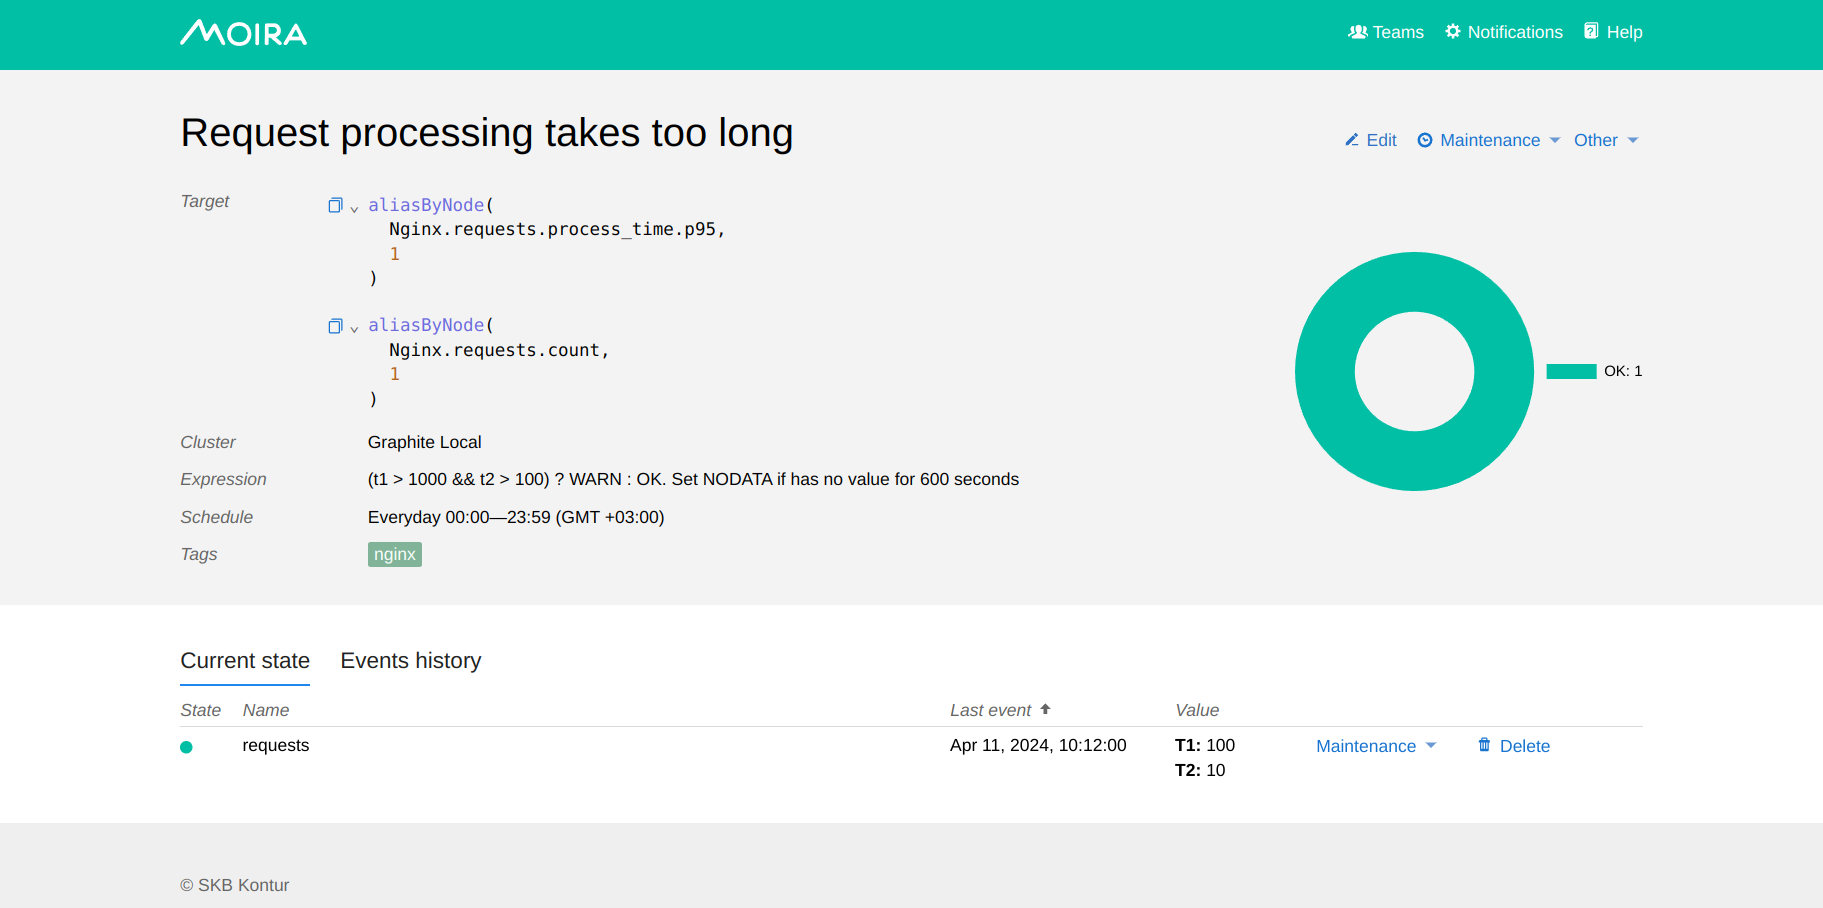
aliasByNode is needed so that the final name of the metric for two targets is the same
You can use any govaluate expression with predefined constants here:
t1,t2, … are values from your targetsOK,WARN,ERROR,NODATAare states that must be the result of evaluationPREV_STATEis equal to previously set state, and allows you to prevent frequent state changes
Any incorrect expressions or bad syntax will result in EXCEPTION trigger state.
If you do not use alone metrics, it is important that the names of the metrics received at the output for several targets are the same so that they can be matched. Use aliasByTags, aliasByNode and other similar functions.
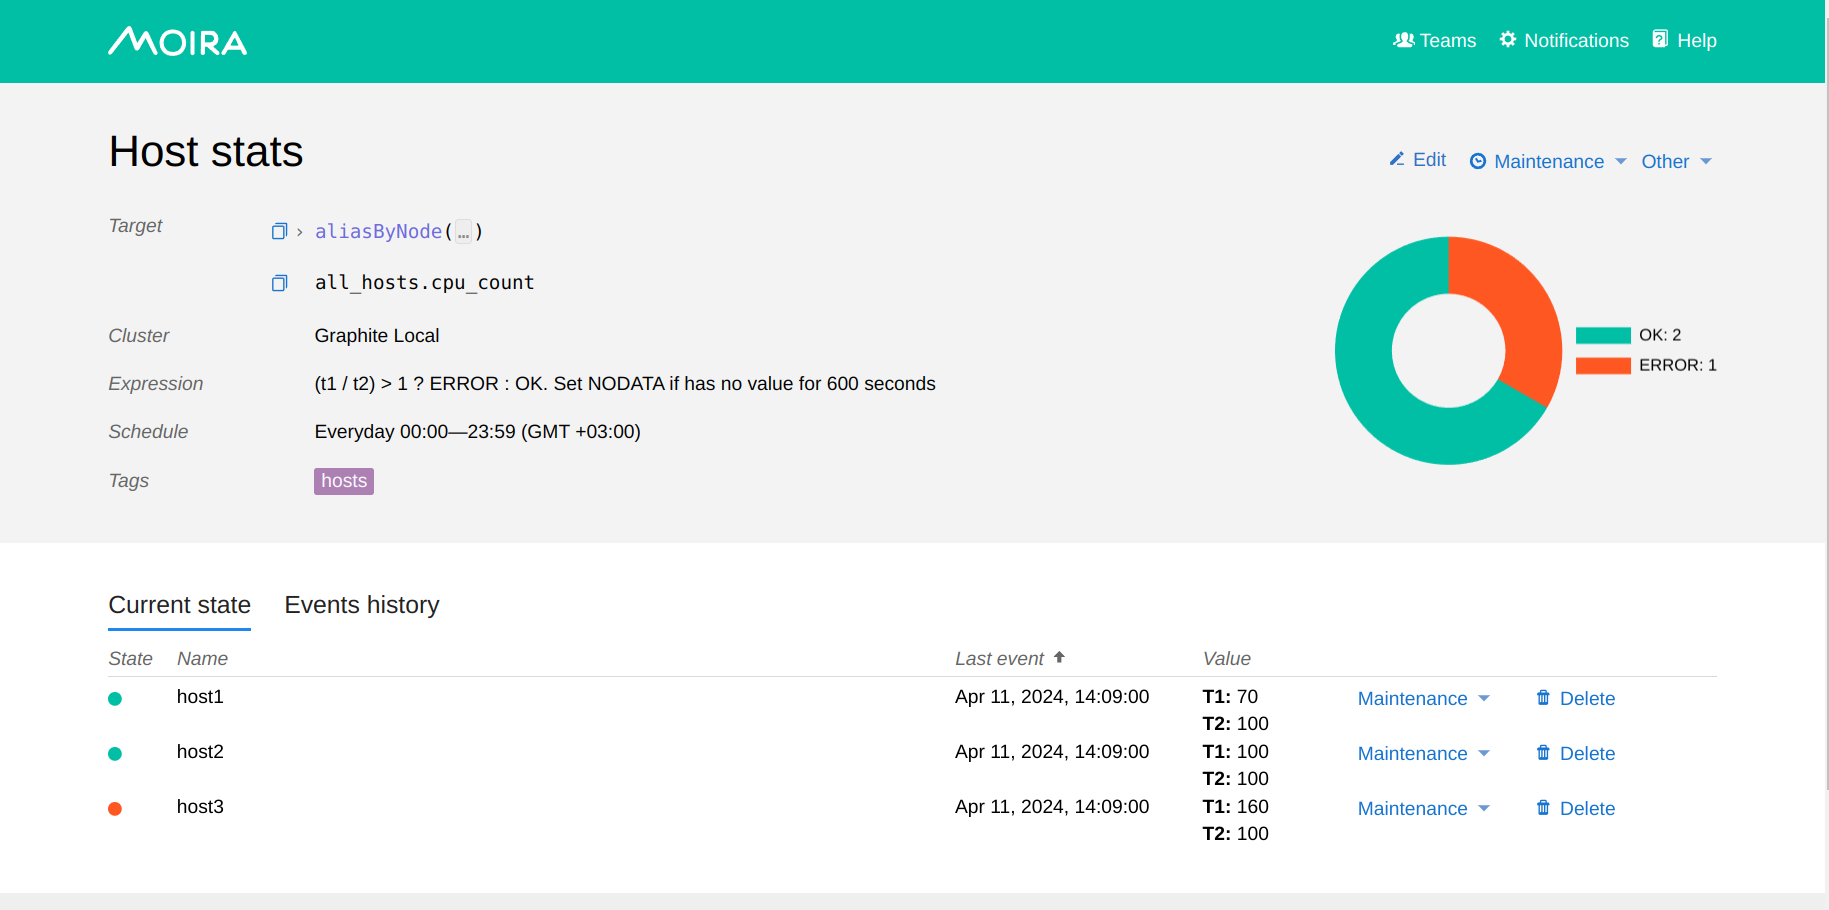
Example 1. Correct use of Advanced Mode
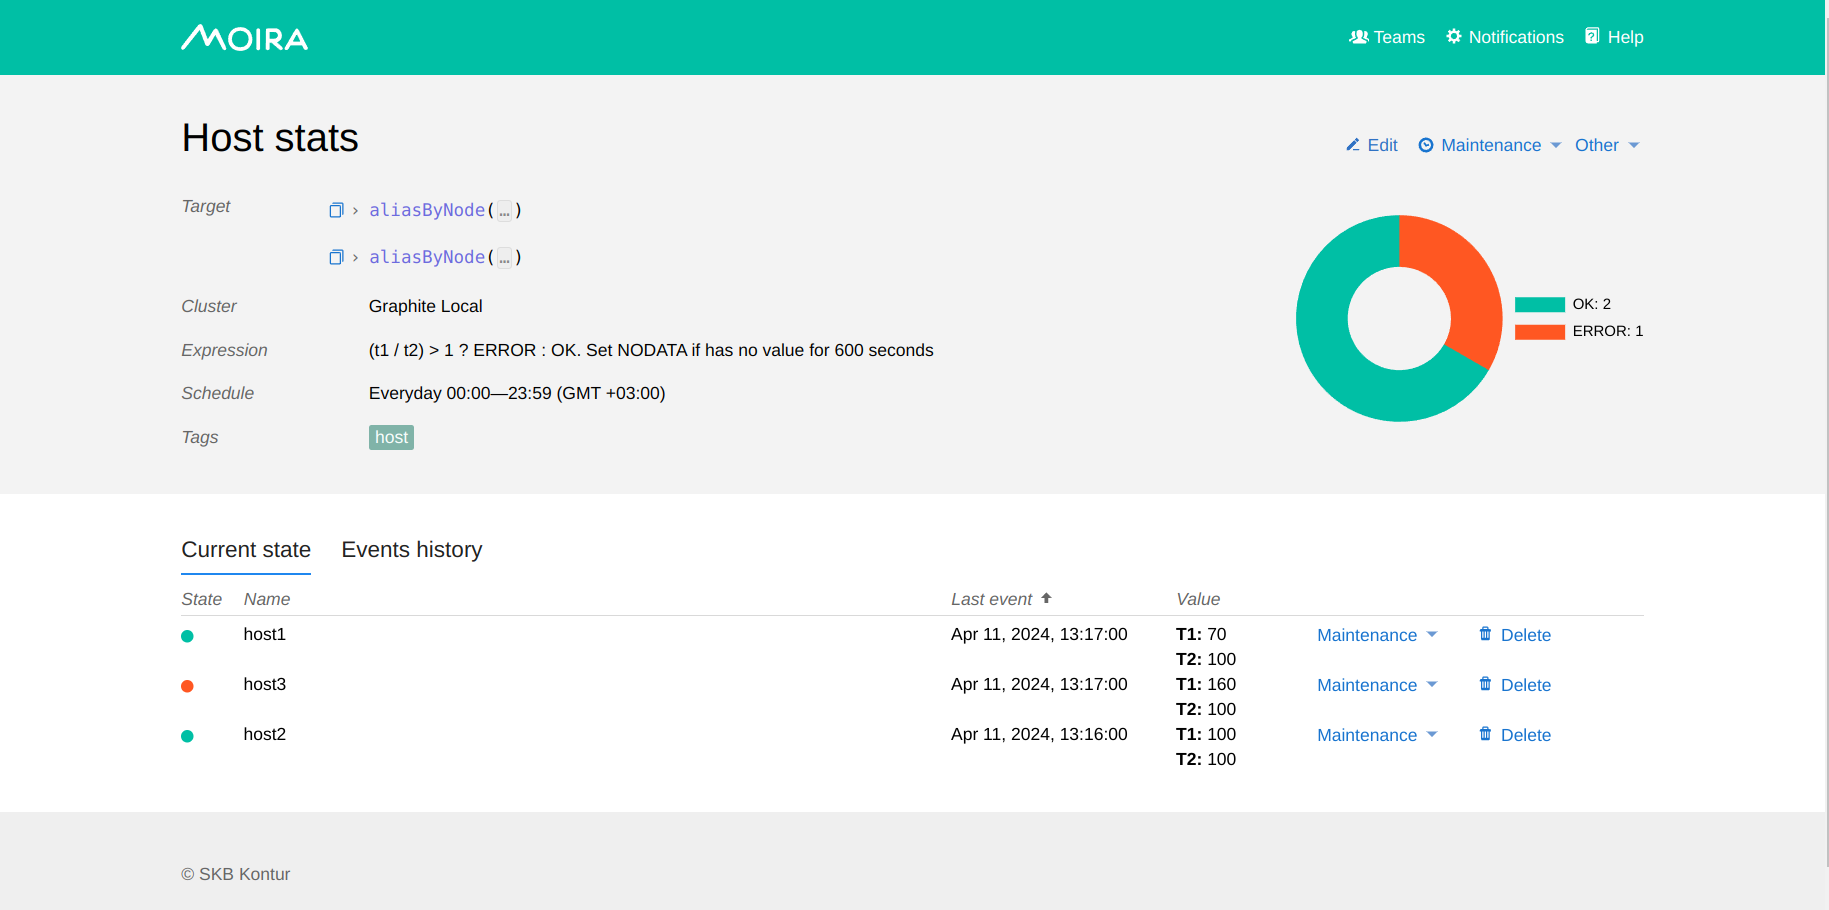
- Suppose you have metrics:
host1.loadavg— Load Average on server host1host2.loadavghost3.loadavghost1.cpu_count— Number of cores on host1host2.cpu_counthost3.cpu_count
- You are creating an Advanced Mode trigger:
- t1 —
aliasByNode(*.loadavg, 0) - t2 —
aliasByNode(*.cpu_count, 0)
Expression — (t1 / t2) > 1 ? ERROR : OK
- This results in three metrics in the trigger, for which the state is tracked separately:
host1— expression is calculated fort1 = host1.loadavg, t2 = host1.cpu_counthost2— expression is calculated fort1 = host2.loadavg, t2 = host2.cpu_counthost3— expression is calculated fort1 = host3.loadavg, t2 = host3.cpu_count
Example 2. Incorrect use of Advanced Mode
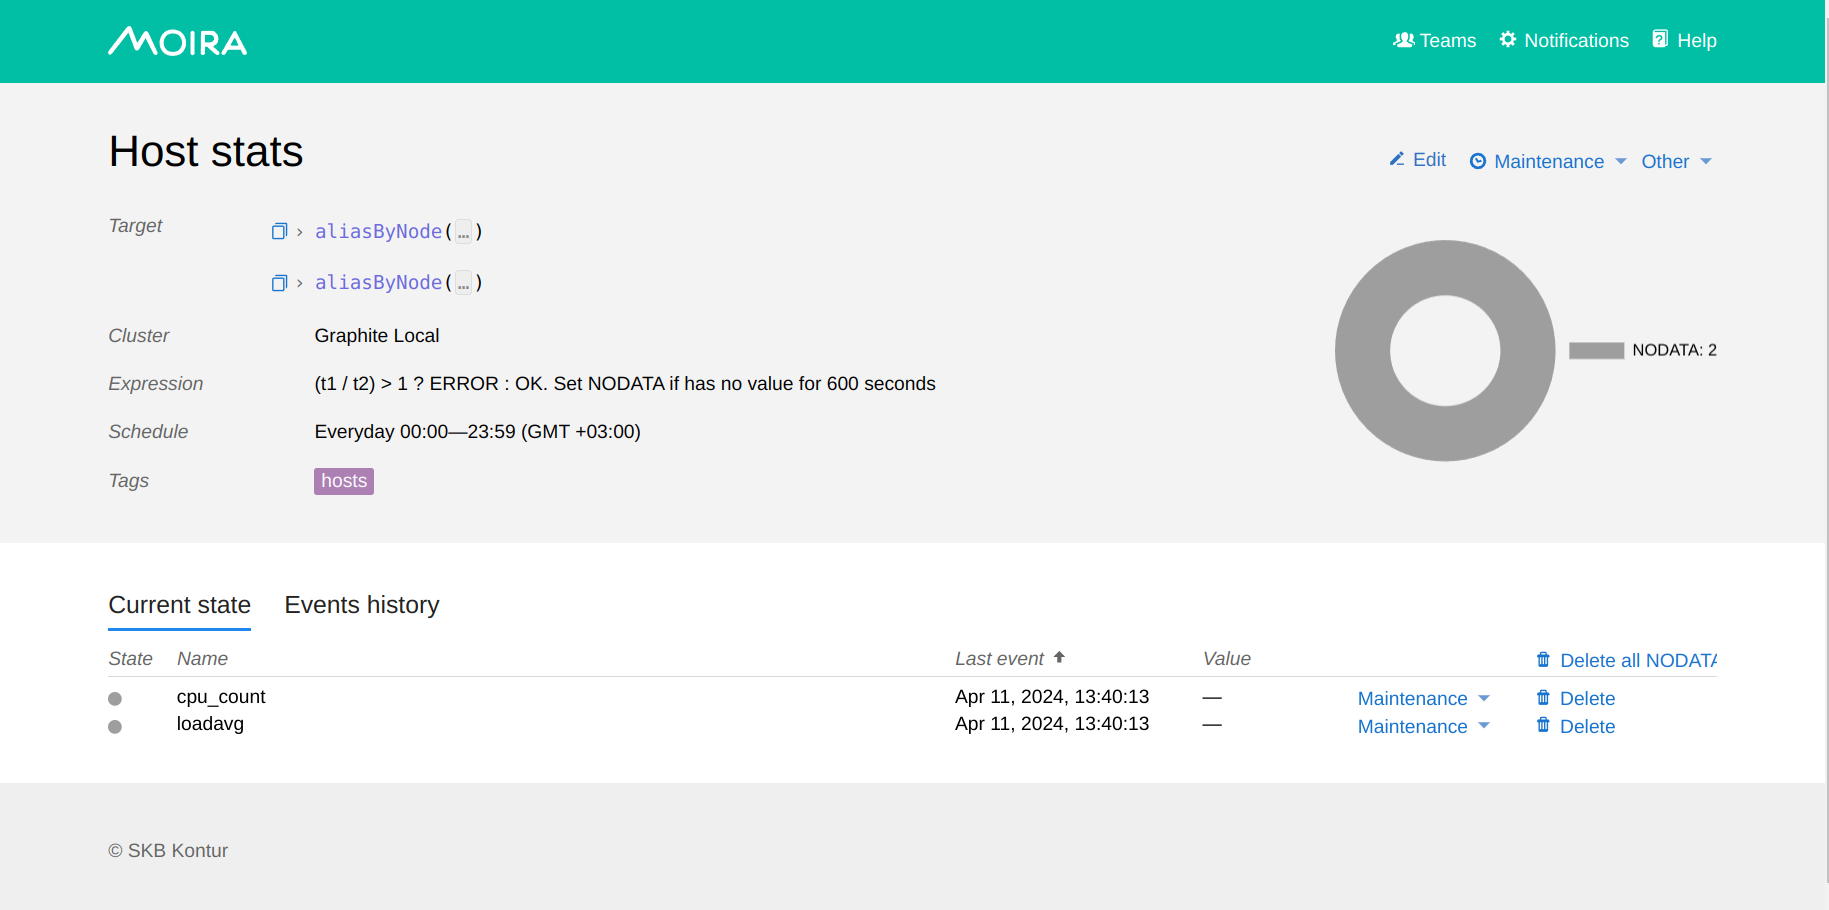
- Suppose you have metrics:
host1.loadavg— Load Average on server host1host1.cpu_count— Number of cores on host1
- You are creating an Advanced Mode trigger:
- t1 —
aliasByNode(*.loadavg, 1) - t2 —
aliasByNode(*.cpu_count, 1)
Expression — (t1 / t2) > 1 ? ERROR : OK
- This results in two metrics in the trigger:
loadavg— expression is calculated fort1 = host1.loadavg, t2 = NaN,NaNappeared because there are no metrics namedloadavgin the second target.cpu_count— expression is calculated fort1 = NaN, t2 = host2.cpu_count,NaNappeared because there are no metrics namedcpu_countin the first target.
NaN is a series in which there are no points, it will not be possible to correctly calculate the expression with it,
so both final metrics will be in NODATA.
Alone Target
Alone targets are targets that result in a single metric, for example, you can use grouping functions (groupByNode, groupByTags and other similar ones) for such targets.
The advantage of such targets is that it is very easy to use them in Advanced Mode, it is not necessary that the metrics that result from such targets have the same name as the metrics of non alone targets.
A single checkbox appears in the Moira web interface after adding new targets to mark some target as Alone.
It is important that the Alone target returns only one series of values. If the single flag is set but more target series are returned,
the trigger will change state to EXCEPTION.
Example 3. Using single and not single targets
- Suppose you have metrics:
host1.loadavg— Load Average on server host1host2.loadavghost3.loadavgall_hosts.cpu_count— Number of cores on any of the servers (the same everywhere)
- You are creating an Advanced Mode trigger:
- t1 —
aliasByNode(*.loadavg, 0) - t2 —
all_hosts.cpu_count— alone metric
Expression — (t1 / t2) > 1 ? ERROR : OK
- This results in three metrics in the trigger, for which the state is tracked separately:
host1— expression is calculated fort1 = host1.loadavg, t2 = all_hosts.cpu_counthost2— expression is calculated fort1 = host2.loadavg, t2 = all_hosts.cpu_counthost3— expression is calculated fort1 = host3.loadavg, t2 = all_hosts.cpu_count
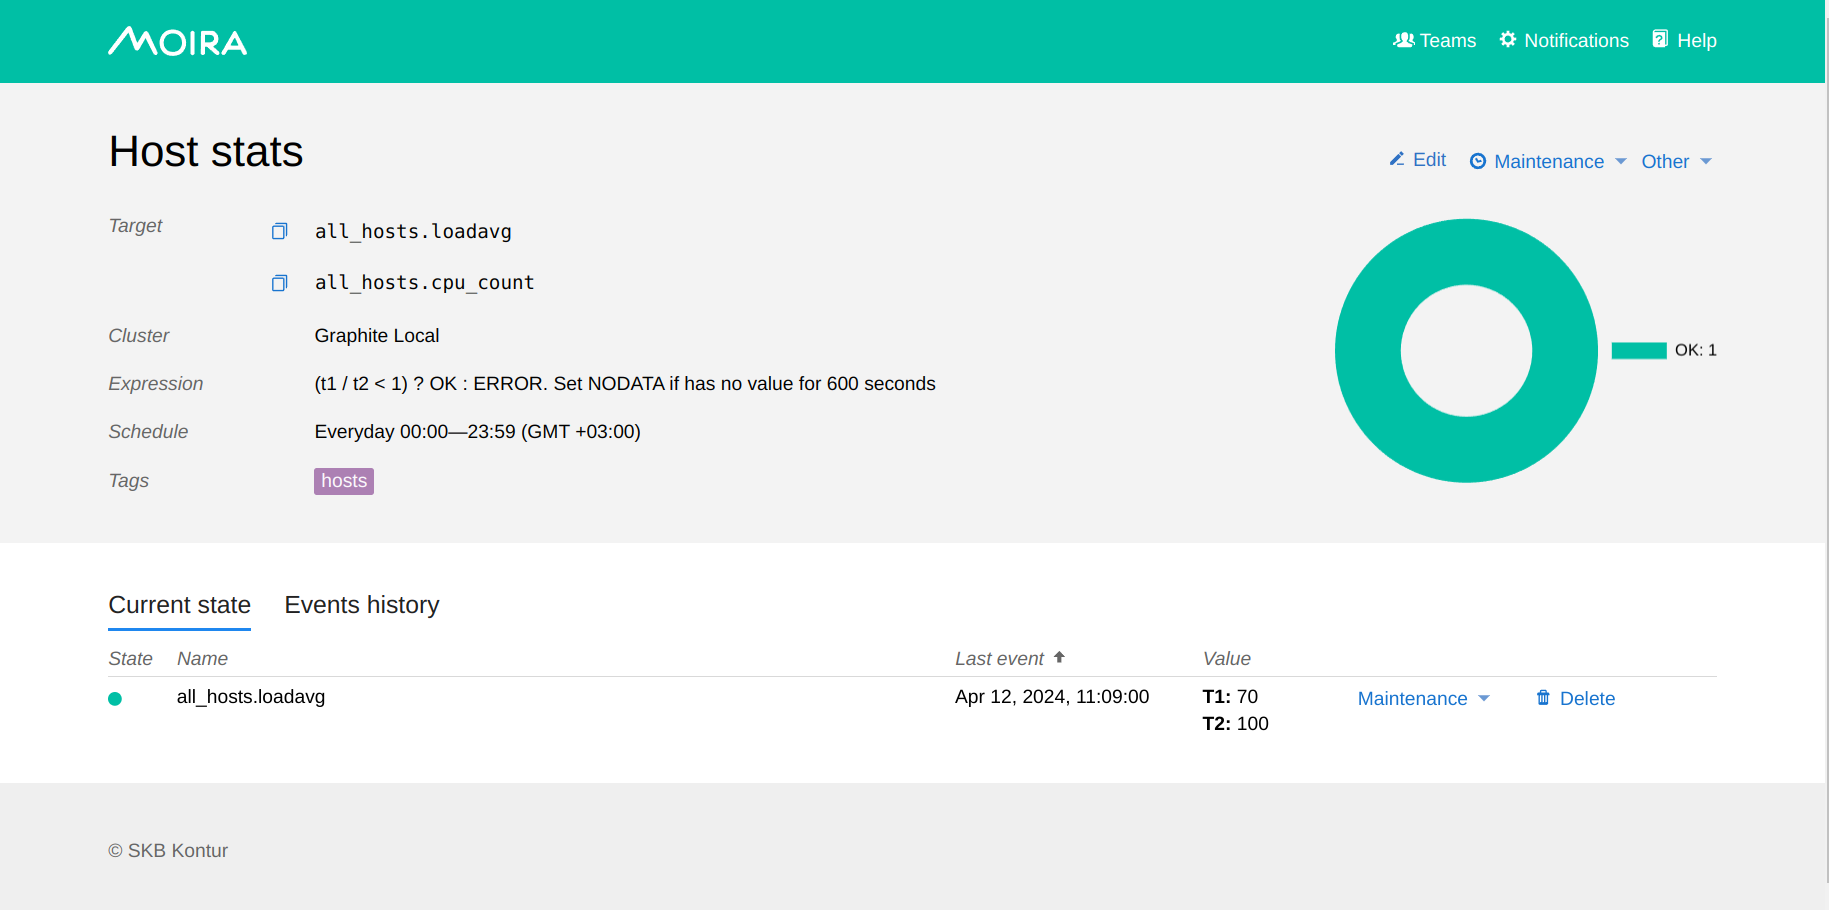
Example 4. Using only single targets
- Suppose you have metrics:
all_hosts.loadavg— Load Average on any of the servers (the same everywhere)all_hosts.cpu_count— Number of cores on any of the servers (the same everywhere)
- You are creating an Advanced Mode trigger:
- t1 —
all_hosts.loadavg— alone metric - t2 —
all_hosts.cpu_count— alone metric
Expression — (t1 / t2) < 1 ? OK : ERROR
- This results in one metric in the trigger:
all_hosts.loadavg— expression is calculated fort1 = all_hosts.loadavg, t2 = all_hosts.cpu_count
If the trigger has all single targets, there will always be one metric whose name will be the same as the metric for the first target.
Templates
The template is supported by Moira, the template implements data-driven templates for generating textual output. Information about how to program the templates themselves, see the documentation. You can also use functions from sprig-library.
Data you can use:
Trigger { Name }
Events  [ ] {
 Metric
 MetricElements [ ]string
 Timestamp
 Value
 State
}
Example:
https://grafana.yourhost.com/some-dashboard{{ range $i, $v := .Events }}{{ if ne $i 0 }}&{{ else }}?
{{ end }}var-host={{ $v.Metric }}{{ end }}
Strings manipulations
{{ stringsReplace .Trigger.Name "." "_" -1 }}{{ stringsToLower .Trigger.Name }}{{ stringsToUpper .Trigger.Name }}{{ stringsTrimPrefix .Trigger.Name "remove_me" }}{{ stringsTrimSuffix .Trigger.Name "remove_me" }}{{ stringsSplit .Trigger.Name "sep" }}
See more about functions and args in golang strings <https://golang.org/pkg/strings>.
Date manipulations
{{ date $v.Timestamp }}print date timestamp.{{ formatDate $v.Timestamp "Mon Jan _2 15:04:05 2006" }}format timestamp by pattern, see more.
Also you can use some methods for events:
{{ range $event:= .Events }}
{{ $event.TimestampDecrease 5 }}
{{ end }}
{{ $event.TimestampDecrease 5 }}- decrease event timestamp.{{ $event.TimestampIncrease 5 }}- increase event timestamp.
Data source
If Remote Triggers Checker or Prometheus Checker is enabled, you can choose between following Data Sources:
Local_ — Moira database. By default Redis stores data for only several hours. It covers most of user cases when you need real-time alerting.
Graphite — remote Graphite-like HTTP API. It should be used only when you need to get metrics for a large period. (Only if Remote Triggers Checker is enabled) .. warning:: Please, use this Data Source with caution. It may cause extra load on Graphite HTTP API.
Important
Please, keep in mind that functions in Remote and Local triggers can work differently. To avoid this, make sure you use Carbonapi with the same revision as in Moira. Latest Carbonapi listed in ../changelog.
Prometheus — remote Prometheus HTTP API. It could be used to select Prometheus metrics via PromQL. (Only if Prometheus Checker is enabled)